Empower and Revitalize Japan for Next Generation
Enjoy our initiatives and ideas that embody SOPHOLA's Vision, Mission and Values.
We will update our employees' daily lives and thoughts so that you can understand the SOPHOLA culture.
Attention Insight|Analyze a Shopping Website for Rice!
Attention Insight is a groundbreaking tool that uses its own AI and neuroscience technology to conduct pre-launch creative analysis. One major advantage is that there is no need to introduce measurement tags, which saves time and resources from a technical perspective. For example, it may not be possible to introduce measurement tags in e-commerce marketplaces such as Rakuten Marketplace or Amazon. Even if existing heatmap tools cannot be used in this case, Attention Insight can predict how much attention human vision will pay to each section of a page within 3-5 seconds after it is displayed, which can greatly assist in improving the page.
As an example, after watching a news program about rice this morning, I felt like analyzing a rice shopping site using Attention Insight. The site I analyzed was “Oishii Omiseya-san,” a rice shopping site owned by Shinmei which was founded in the same month as SOPHOLA. This company is known for its popular series of rice, including “Akafuji-mai is the most delicious rice in Kansai♪,” as well as other rice products.
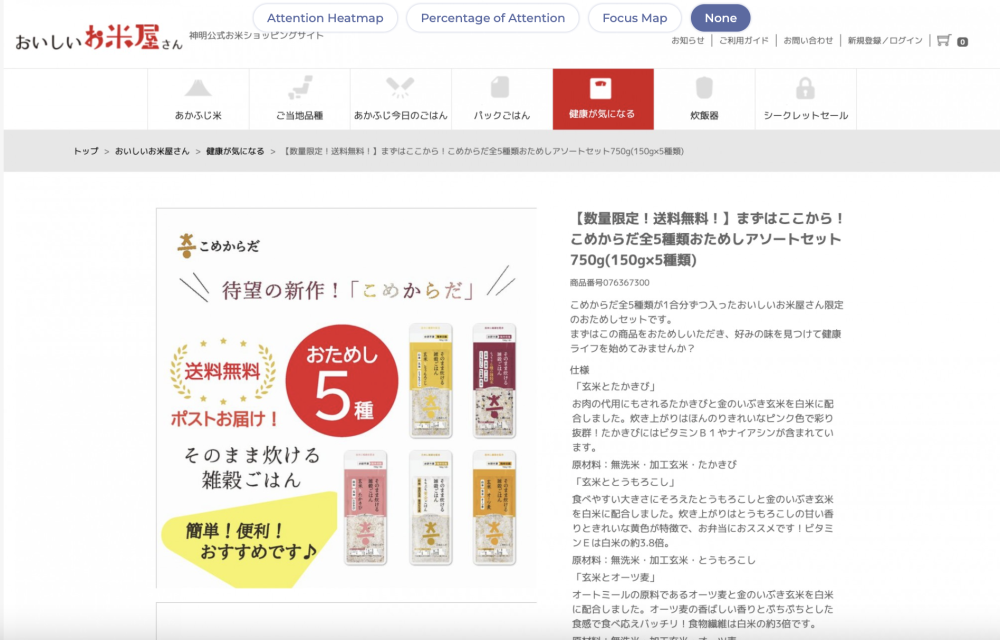
I chose to analyze one of the product detail pages on this site, the “Kome Karada All 5 Types Trial Assortment Set.” Here is the first page view of this site.
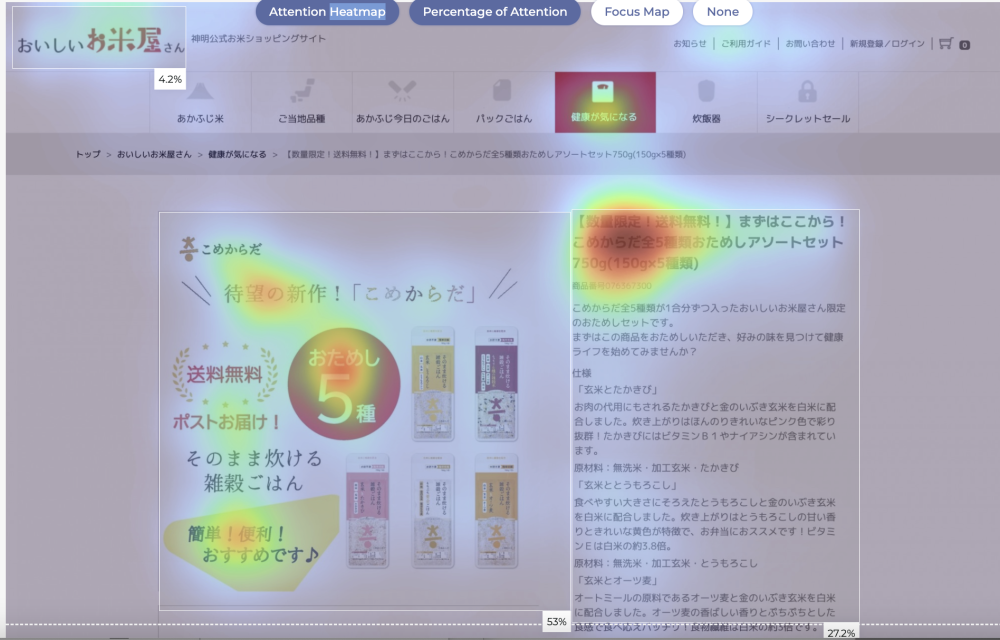
 When conducting an analysis of the Attention Heatmap on this first view, the distribution of visual attention on the logo, product images, titles, and descriptions looks fine with me. However, it appears that there is little visual attention on the important product packaging and descriptions.
Next, to visualize where the blind spots are, I tried using the Focus Map.
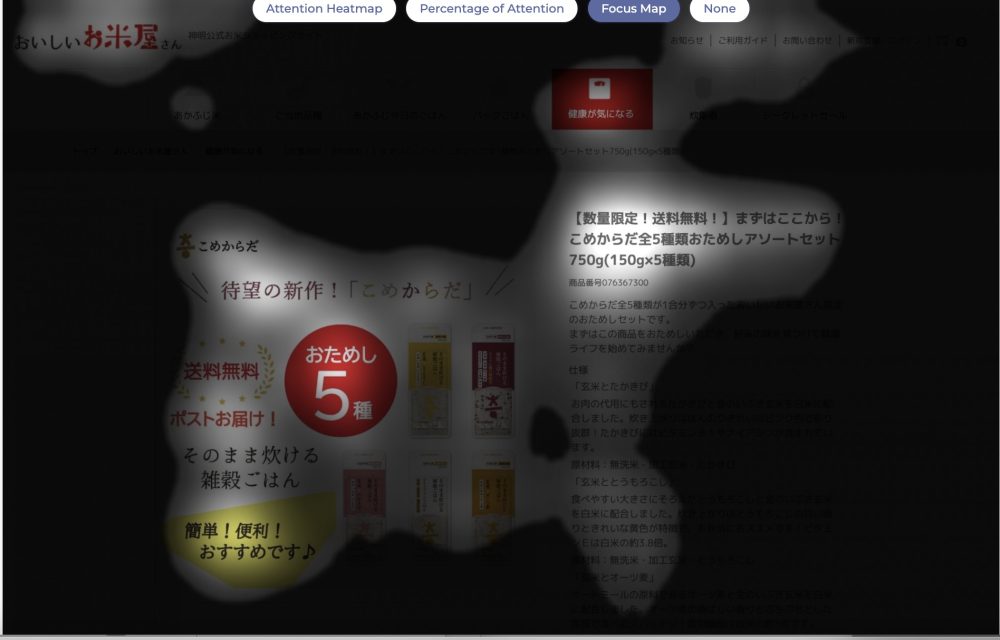 Visual attention is directed towards other appeals such as product name and free shipping rather than the product package, and about half of the description text is in a blind spot. If this is acceptable for marketers, there may be no issue, but if they want customers to pay more attention to the package and read the description more carefully, they could try designing a more striking package or using bold fonts to make the description more compact. The next section on the page features the most important page action, the CTA button “Add to cart”.
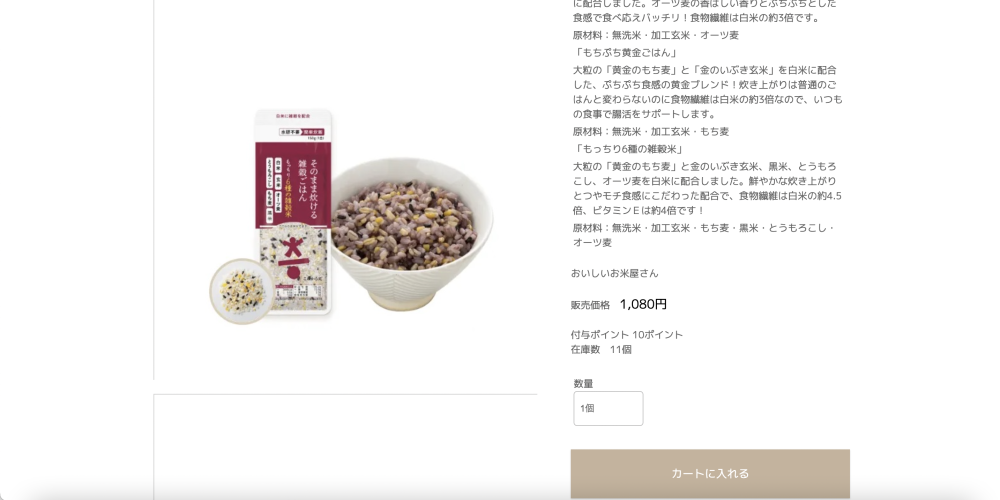
If we follow the same analysis process as before,
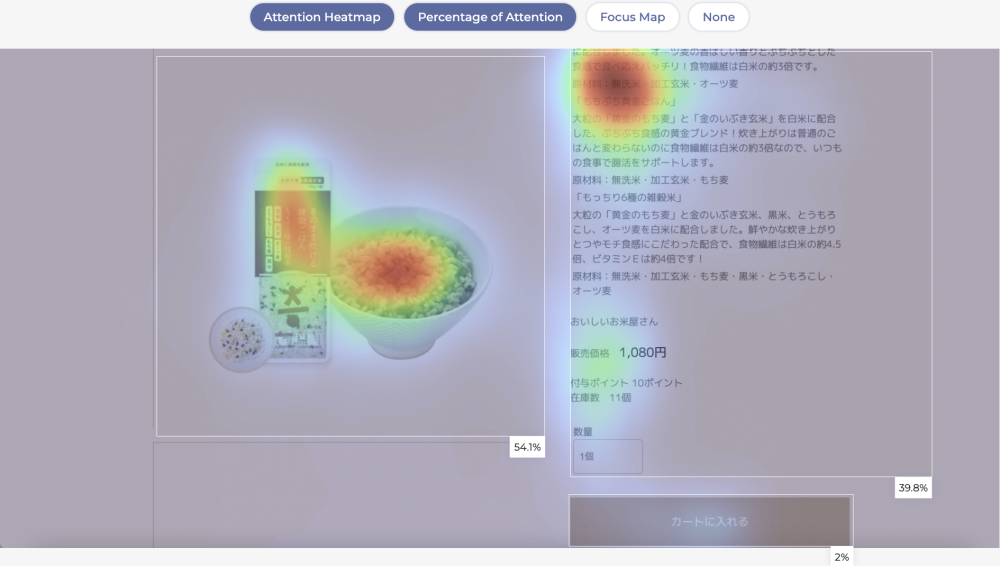
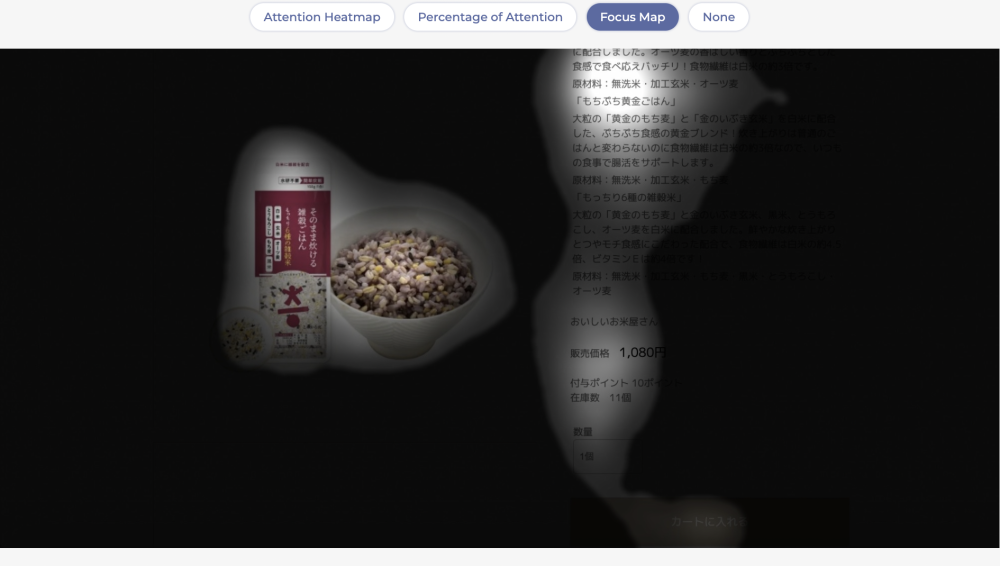 When analyzing the Attention Heatmap, I noticed that most of the visual attention is focused on the first part of the product description and product image, while the CTA button is somewhat neglected. The Focus Map confirmed that the CTA button is in a blind spot. Based on the analysis of the first view, if we make the product description more concise and start this section from the price, we may improve the visual attention percentage for the CTA button. We can also consider changing the color of the button to increase visual attention.
How was the post-launch product detail page analysis using Attention Insight? If you are an EC owner or consulting company whose product detail page analysis is not possible due to tagging issues or workload problems, please try using Attention Insight!
Masaki “Mark” Iino
Founder & CEO
SOPHOLA, Inc